Anytime you have lat / long coordinates, you have an opportunity to do data science with kmeans clustering and visualization on a map. This is a story about how I used geo data with kmeans clustering that relates to a topic which has effected me personally - wildfires!
Every summer wildfires become front-of-mind for thousands of people who live in the west, Pacific Northwest, and Northern Rockies regions of the United States. Odds are, if you don’t see the flames first hand, you will probably see smoke influenced weather, road closures, and calls for caution by local authorities.
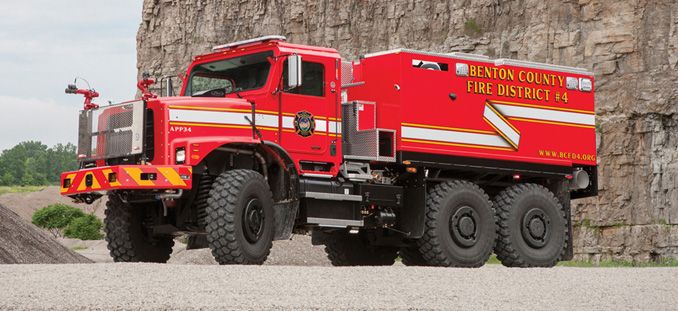
I’ve lived in Oregon for about 10 years. In that time I’ve had more than one close encounter with a forest fire. This past summer was especially bad.  A fire in the Columbia River Gorge blew smoke and ash through my neighborhood. Earlier in the year I crossed paths with firefighters attempting to control a fire in steep rugged terrain in southern Washington. I was stunned to see the size of their equipment and trucks so badass they could be in a Mad Max movie.
Fire fighting is big business. Wildland fire suppression costs exceeded $2 billion in 2017, making it the most expensive year on record for the Forest Service. Fires also have a tendency to explode in size. It’s not unusual for fires to grow by 40,000 acres in one day when winds are high and the terrain is steep. Let’s look at one small way in which data science could be applied within the context of streamlining fire fighting operations in order to reduce costs and response time.
The Problem
I’m attempting to minimize the cost and time required to respond to fires by identifying where firefighting assets should be staged such that they are as close as possible to where fires are likely to occur.
The Solution:
My goal is to predict where forest fires are prone to occur by partitioning the locations of past burns into clusters whose centroids can be used to optimally place heavy fire fighting equipment as near as possible to where fires are likely to occur. The K-Means clustering algorithm is perfectly suited for this purpose.
The United States Forest Service provides datasets that describe forest fires that have occurred in Canada and the United States since year 2000. That data can be downloaded from https://fsapps.nwcg.gov/gisdata.php. For my purposes, this dataset is provided in an inconvenient shapefile format. It needs to be transformed to CSV in order to be easily usable by Spark. ![]() Also, the records after 2008 have a different schema than prior years, so after converting the shapefiles to CSV they’ll need to be ingested into Spark using separate user-defined schemas. By the way, this complexity is typical. Raw data is hardly ever suitable for machine learning without cleansing. The process of cleaning and unifying messy data sets is called “data wrangling” and it frequently comprises the bulk of the effort involved in real world machine learning.
Also, the records after 2008 have a different schema than prior years, so after converting the shapefiles to CSV they’ll need to be ingested into Spark using separate user-defined schemas. By the way, this complexity is typical. Raw data is hardly ever suitable for machine learning without cleansing. The process of cleaning and unifying messy data sets is called “data wrangling” and it frequently comprises the bulk of the effort involved in real world machine learning.
Apache Zeppelin
![]()
The data wrangling that precedes machine learning typically involves writing expressions in R, SQL, Scala, and/or Python which join and transform sampled datasets. Often, getting these expressions right involves a lot of trial and error. Ideally you want to test those expressions without the burden of compiling and running a full program. Data scientists have embraced web based notebooks, such as Apache Zeppelin, for this purpose because they allow you to interactively transform datasets and know right away if what you’re trying to do will work properly.
The Zeppelin notebook I wrote for this study contains a combination of Bash, Python, Scala, and Angular code.
Here’s the bash code I use to download the dataset:
%sh
mkdir -p /mapr/my.cluster.com/user/mapr/data/fires
cd /mapr/my.cluster.com/user/mapr/data/fires
curl -s --remote-name https://fsapps.nwcg.gov/afm/data/fireptdata/modis_fire_2016_365_conus_shapefile.zip
curl -s --remote-name https://fsapps.nwcg.gov/afm/data/fireptdata/modis_fire_2015_365_conus_shapefile.zip
curl -s --remote-name https://fsapps.nwcg.gov/afm/data/fireptdata/modis_fire_2014_365_conus_shapefile.zip
curl -s --remote-name https://fsapps.nwcg.gov/afm/data/fireptdata/modis_fire_2013_365_conus_shapefile.zip
curl -s --remote-name https://fsapps.nwcg.gov/afm/data/fireptdata/modis_fire_2012_366_conus_shapefile.zip
curl -s --remote-name https://fsapps.nwcg.gov/afm/data/fireptdata/modis_fire_2011_365_conus_shapefile.zip
curl -s --remote-name https://fsapps.nwcg.gov/afm/data/fireptdata/modis_fire_2010_365_conus_shapefile.zip
curl -s --remote-name https://fsapps.nwcg.gov/afm/data/fireptdata/modis_fire_2009_365_conus_shapefile.zip
curl -s --remote-name https://fsapps.nwcg.gov/afm/data/fireptdata/mcd14ml_2008_005_01_conus_shp.zip
curl -s --remote-name https://fsapps.nwcg.gov/afm/data/fireptdata/mcd14ml_2007_005_01_conus_shp.zip
curl -s --remote-name https://fsapps.nwcg.gov/afm/data/fireptdata/mcd14ml_2006_005_01_conus_shp.zip
curl -s --remote-name https://fsapps.nwcg.gov/afm/data/fireptdata/mcd14ml_2005_005_01_conus_shp.zip
curl -s --remote-name https://fsapps.nwcg.gov/afm/data/fireptdata/mcd14ml_2004_005_01_conus_shp.zip
curl -s --remote-name https://fsapps.nwcg.gov/afm/data/fireptdata/mcd14ml_2003_005_01_conus_shp.zip
curl -s --remote-name https://fsapps.nwcg.gov/afm/data/fireptdata/mcd14ml_2002_005_01_conus_shp.zip
curl -s --remote-name https://fsapps.nwcg.gov/afm/data/fireptdata/mcd14ml_2001_005_01_conus_shp.zip
find modis*.zip | xargs -I {} unzip {} modis*.dbf
find mcd*.zip | xargs -I {} unzip {} mcd*.dbf
Here’s the python code I use to convert the downloaded datasets to CSV files:
%python
import csv
from dbfpy import dbf
import os
import sys
DATADIR='/mapr/my.cluster.com/user/mapr/data/fires/'

for filename in os.listdir(DATADIR):

    if filename.endswith('.dbf'):
        print "Converting %s to csv" % filename
        csv_fn = DATADIR+filename[:-4]+ ".csv"
        with open(csv_fn,'wb') as csvfile:
            in_db = dbf.Dbf(DATADIR+filename)
            out_csv = csv.writer(csvfile)
            names = []
            for field in in_db.header.fields:
                names.append(field.name)
            out_csv.writerow(names)
            for rec in in_db:
                out_csv.writerow(rec.fieldData)
            in_db.close()
            print "Done..."
Here’s the Scala code I use to ingest the CSV files and train a K-Means model with Spark libraries:
import org.apache.spark._
import org.apache.spark.rdd.RDD
import org.apache.spark.sql.types._
import org.apache.spark.sql.functions._
import org.apache.spark.sql._
import org.apache.spark._
import org.apache.spark.ml.feature.StringIndexer
import org.apache.spark.ml.feature.VectorAssembler
import org.apache.spark.ml.clustering.KMeans
import org.apache.spark.ml.clustering.KMeansModel
import org.apache.spark.mllib.linalg.Vectors
import sqlContext.implicits._
import sqlContext._
//AREA,PERIMETER,FIRE_,FIRE_ID,LAT,LONG,DATE,JULIAN,GMT,TEMP,SPIX,TPIX,SRC,SAT_SRC,CONF,FRP
val schema = StructType(Array(
StructField("area", DoubleType, true),
StructField("perimeter", DoubleType, true),
StructField("firenum", DoubleType, true),
StructField("fire_id", DoubleType, true),
StructField("lat", DoubleType, true),
StructField("lon", DoubleType, true),
StructField("date", TimestampType, true),
StructField("julian", IntegerType, true),
StructField("gmt", IntegerType, true),
StructField("temp", DoubleType, true),
StructField("spix", DoubleType, true),
StructField("tpix", DoubleType, true),
StructField("src", StringType, true),
StructField("sat_src", StringType, true),
StructField("conf", IntegerType, true),
StructField("frp", DoubleType, true)
))
val df_all = sqlContext.read.format("com.databricks.spark.csv").option("header", "true").schema(schema).load("/user/mapr/data/fires/modis*.csv")
// Include only fires with coordinates in Cascadia
val df = df_all.filter($"lat" > 42).filter($"lat" < 50).filter($"lon" > -124).filter($"lon" < -110)
val featureCols = Array("lat", "lon")
val assembler = new VectorAssembler().setInputCols(featureCols).setOutputCol("features")
val df2 = assembler.transform(df)
val Array(trainingData, testData) = df2.randomSplit(Array(0.7, 0.3), 5043)
val kmeans = new KMeans().setK(400).setFeaturesCol("features").setMaxIter(5)
val model = kmeans.fit(trainingData)
println("Final Centers: ")
model.clusterCenters.foreach(println)
// Save the model to disk
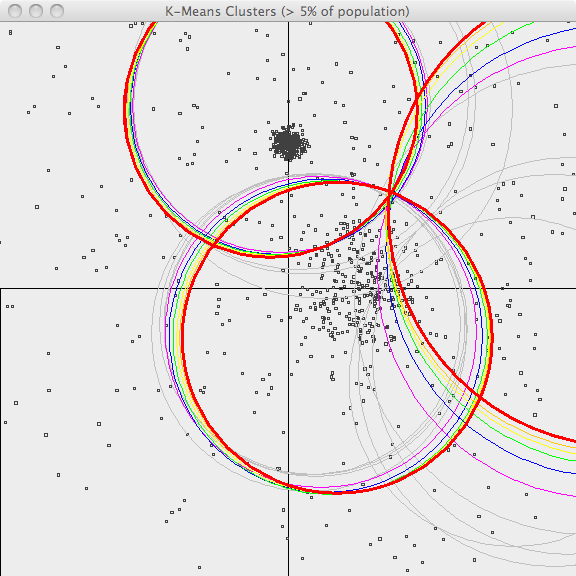
model.write.overwrite().save("/user/mapr/data/save_fire_model")The resulting cluster centers are shown below. Where would you stage firefighting equipment?
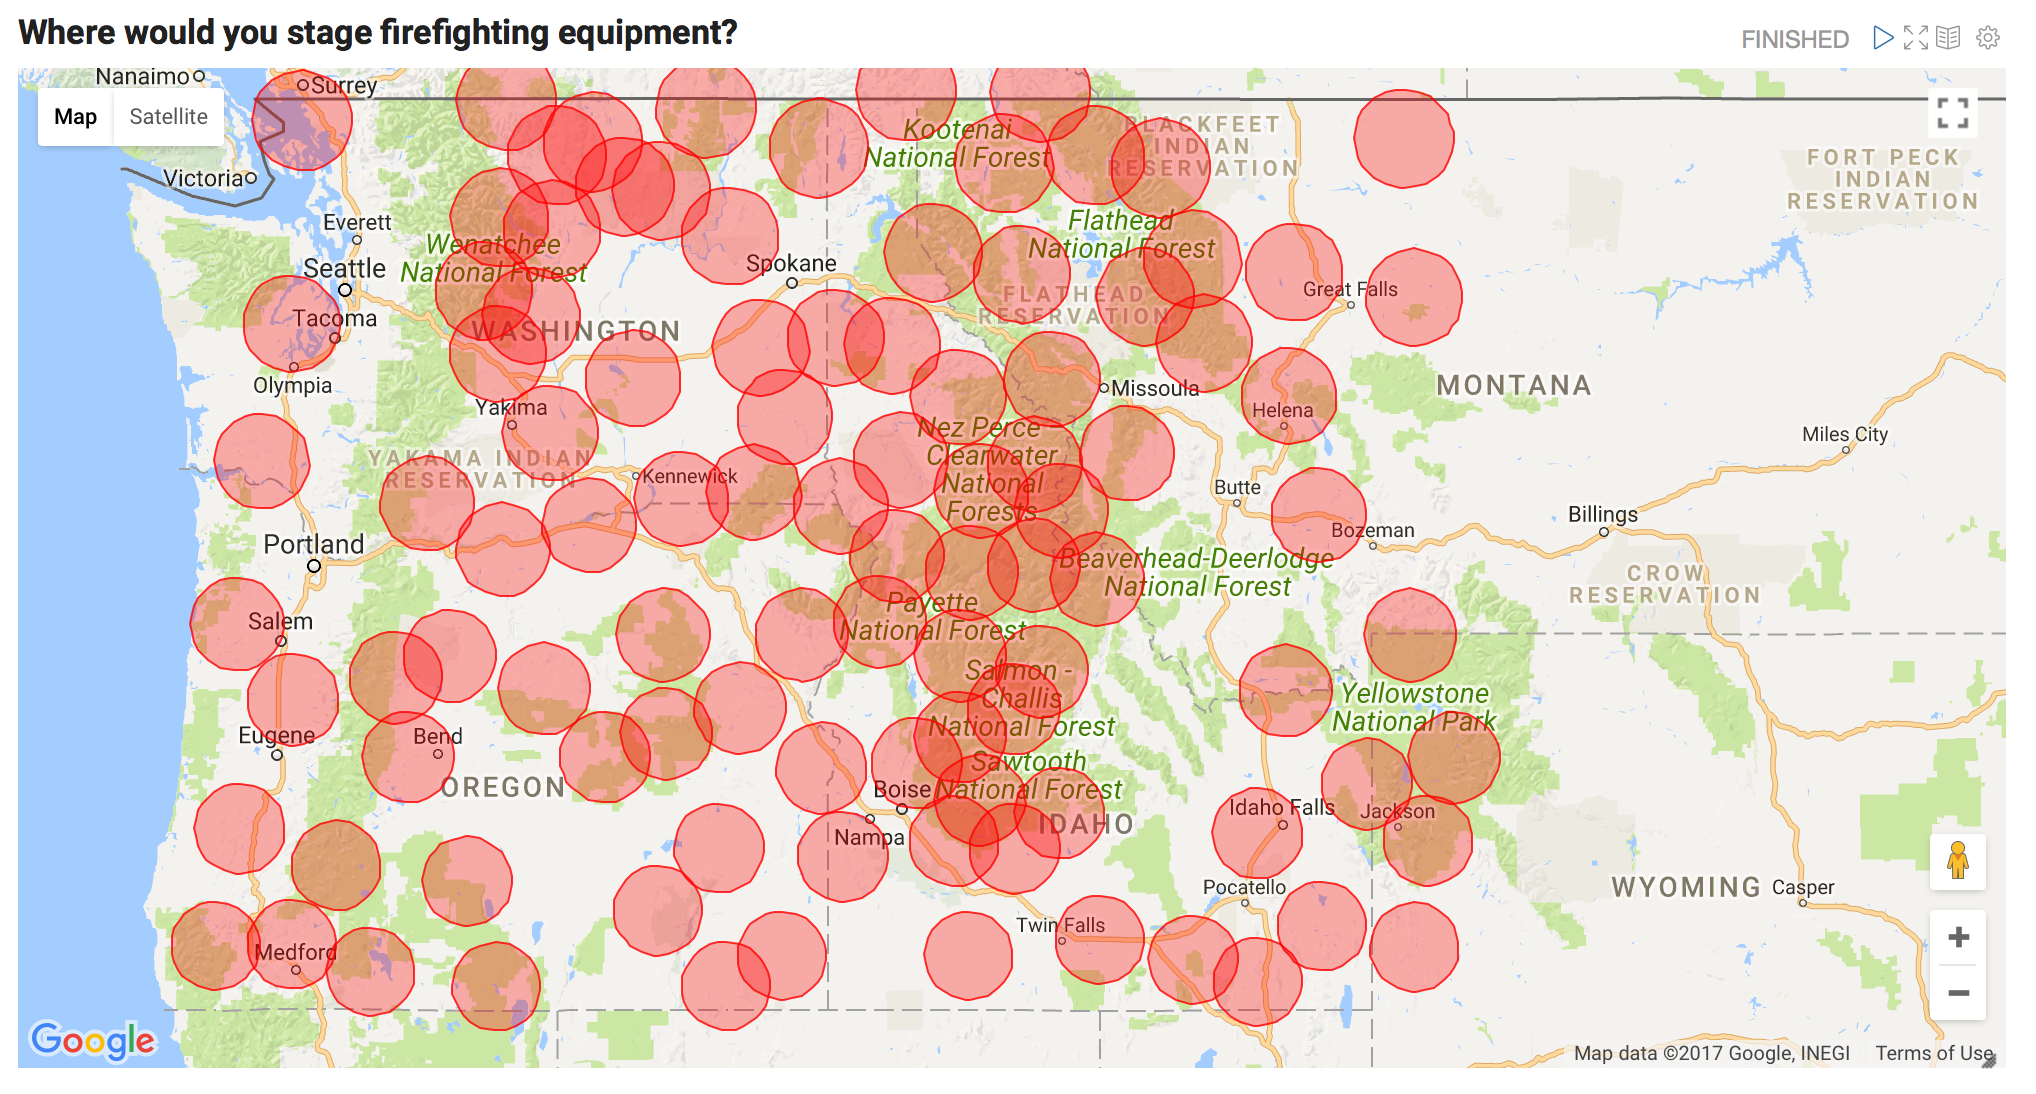
These centroids were calculated by analyzing the locations for fires that have occurred in the past. These points can be used to help stage firefighting equipment as near as possible to regions prone to burn, but how do we know which staging area should respond when a new forest fire starts? We can use our previously saved model to answer that question. The Scala code for that would look like this:
val test_coordinate = Seq((42.3,-112.2 )).toDF("latitude", "longitude")
val df3 = assembler.transform(test_coordinate)
val categories = model.transform(df3)
val centroid_id = categories.select("prediction").rdd.map(r => r(0)).collect()(0).asInstanceOf[Int]
println(model.clusterCenters(centroid_id))
Operationalizing this model as a real-time “Fire Response” App
The previous code excerpt shows how the model we developed could be used to identify which fire station (i.e. centroid) should be assigned to a given wildfire. We could operationlize this as a real-time fire response application with the following ML pipeline:
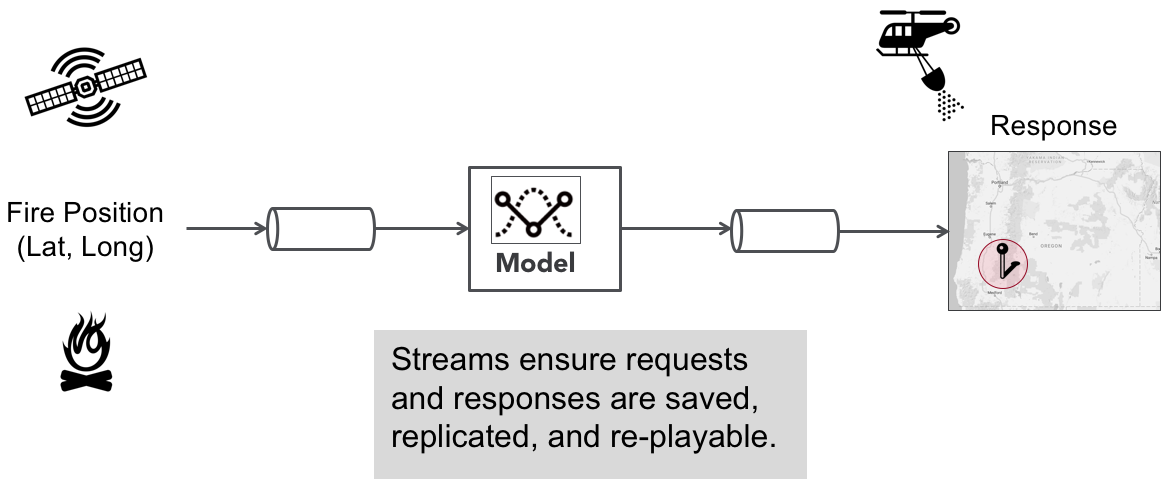
Most machine learning applications are initially architected with a synchronous pipeline like the one shown above, but there are limitations to this simplistic approach. Since it is only architected for a single model your options are limited when it comes to the following:
- How do you A/B test different versions of your model?
- How do you load balance inference requests?
- How do you process inference requests with multiple models optimized for different objectives (e.g. speed vs accuracy)?
In order to do these things the model must be a modular component in the pipeline and model results should rendezvous at a point where their results can be compared, monitored, and selected based upon user-defined critieria. This design pattern can be achieved with an architecture called the Rendezvous Architecture.
The Rendezvous Architecture
The rendezvous architecure is a machine learning pipeline that allows multiple models to process inference requests and “rendezvous” at a point where user-defined logic can be applied to choose which ML result to return to the requester. Such logic could say, “Give me the fastest result” or “give me the highest confidence score after waiting 10 seconds”. The rendezvous point also gives us a point where models can be monitored and requests can be captured where models results significantly disagree with each other.
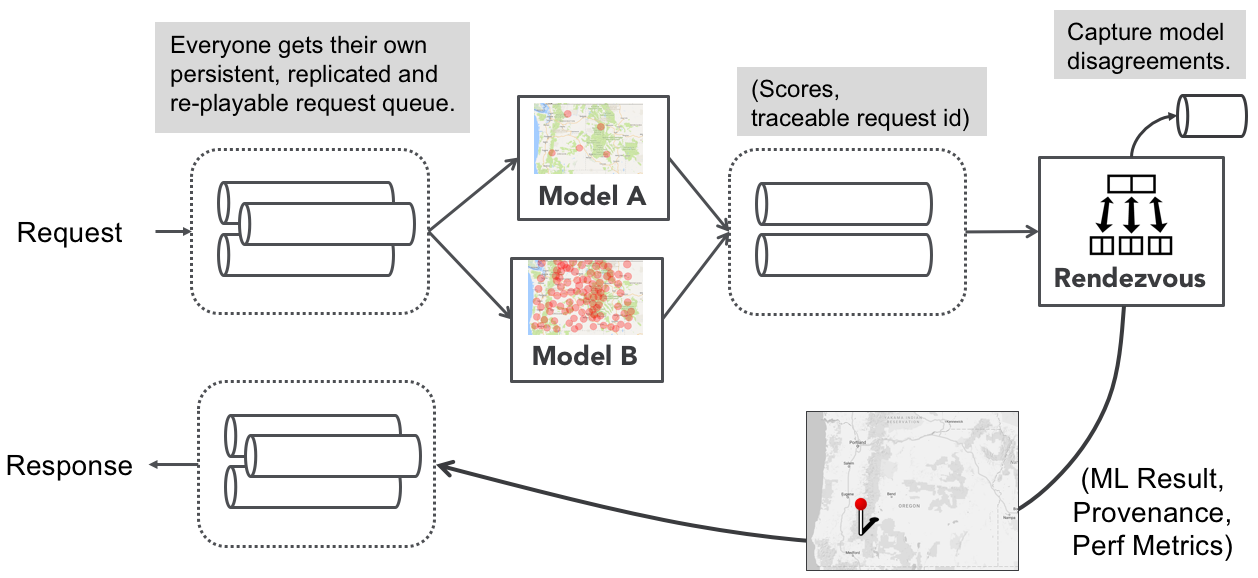
 Note the emphasis on streams. Streams buffer requests in an infinite, resilient, and replayable queue. This makes it easy to hotswap models, scale ML executors in a microservices fashion, and guarantees traceability for every inference request and response.
If you’d like to learn more about the Rendezvous Architecture then read the highly recommended Machine Learning Logistics book from Ted Dunning and Ellen Friedman. It was published in 2017 and is available as a free downloadable ebook from Orielly.
Please provide your feedback to this article by adding a comment to https://github.com/iandow/iandow.github.io/issues/6.
