If you think building data pipelines requires advanced software development skills, think again. A company called StreamSets has created software which enables you to build data pipelines using a drag-and-drop GUI. It frees you from the burden of writing code with the application programming interfaces (APIs) needed to ingest data, transform streaming records, and send to destinations like databases.
![]()
In this post I describe how I built a data pipeline in StreamSets for data generated by IoT sensors and published by an MQTT server. This post should help anyone trying to process JSON metrics through Streamsets to OpenTSDB.
My data source is an MQTT server, which was provided to me by Opto22. Opto22 manufactures smart devices for industrial automation. MQTT is a lightweight messaging protocol for small sensors and mobile devices, optimized for high-latency or unreliable networks.
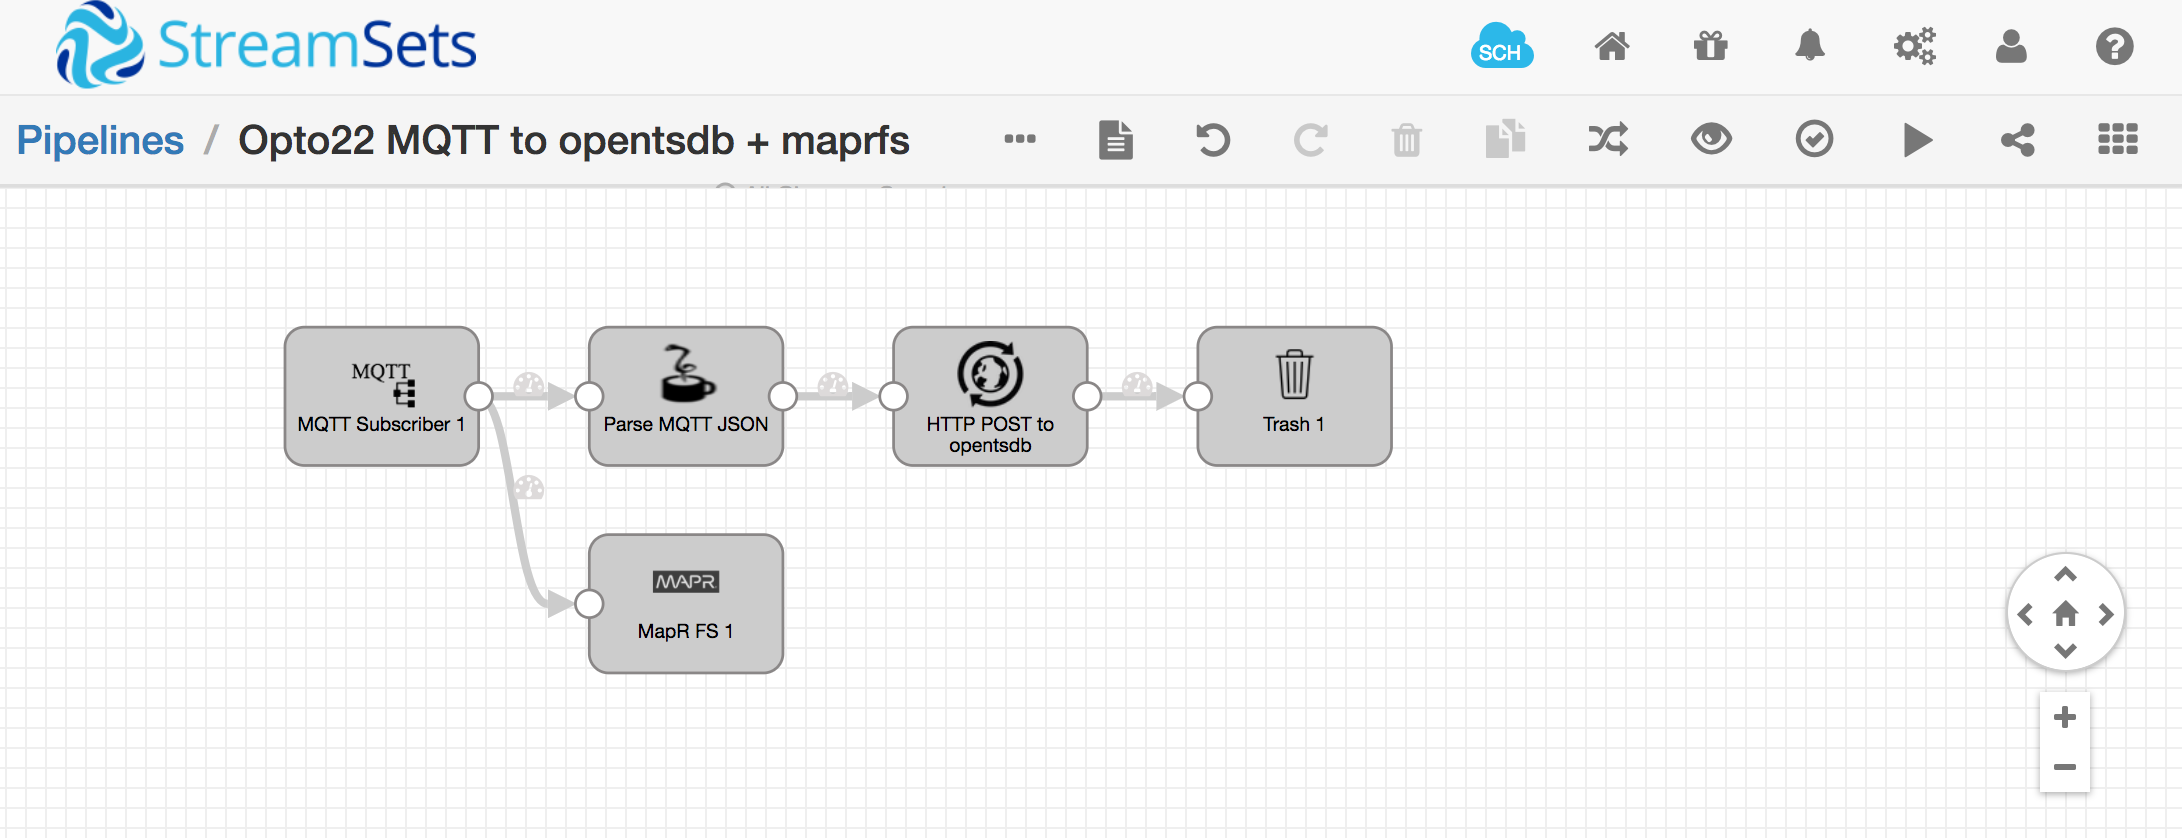
I consumed and transformed MQTT data using StreamSets. StreamSets is a graphical application that allows you to easily create data pipelines via drag-and-drop, without coding, so it’s a real time saver. I published metrics to OpenTSDB, which is a time-series database, and visualized my data in Grafana. Here is what my StreamSets pipeline looks like:
My MQTT data looks like this:
{
  "OutsideAirTemp": "41.7",
  "DaylightSensor": "1",
  "BoilerReturnTemp": "-3.2",
  "BoilerFlowTemp": "98.9",
  "CentralPlantOutsideAirTemp": "45.5",
  ...
  "AH3OaOutDamper": "0.0",
  "AH4OaInDamper": "0.0",
  "AH4ReturnDamper": "0.0",
  "AH4OaOutDamper": "0.0"
}
That entire JSON document is produced once every minute. In order to visualize it in Grafana, I need to parse each individual metric and post its value to OpenTSDB using a REST API. Here’s an example curl command that shows what the OpenTSDB REST API looks like:
curl -X POST --data '{"metric": "OutsideAirTemp", "timestamp": 1346846400, "value": 41.7, "tags": {"host": "Opto22/POC/MapR/HVAC"}}' "http://localhost:4242/api/put"
Note, that timestamp is not provided in the MQTT record. Also note, the value in the tags element is arbitrary, but I think OpenTSDB rejects the POST if you don’t provide it, so I just made something up for “host”.
So, how do you split each value out of the MQTT record, add a timestamp to it, and POST it to OpenTSDB? I’m sure there’s more than one way to skin this cat, but here’s how I did it:
Extracting metrics from MQTT JSON records:
I extracted values from the incoming MQTT stream using a Jython Evaluator, defined with the following code. This script sends a new record down the StreamSets pipeline for every metric. So, for each MQTT read (which in my case happens once per minute), it generates 150 new messages in the streamsets pipeline.
import time
log.info("jython processing a message")
try:
  for record in records:
    for key in record.value:
      newRecord = sdcFunctions.createRecord(record.sourceId+':newRecordId')
      log.info("jython newrecord created")
      newRecord.value = {'timestamp': int(time.time()), 'metric': key, 'value': record.value[key]}
      log.info("jython writing newrecord.value " + str(newRecord.value))
      output.write(newRecord)
  log.info("jython done")
except Exception as e:
  log.info(str(e))
  log.info("jython error done")
If you wanted to add some logging in there, here’s how you would access individual metric values:
log.info("jython sees this record: " + str(record.value))
log.info(str(record.value['OutsideAirTemp']))
POST to OpenTSDB
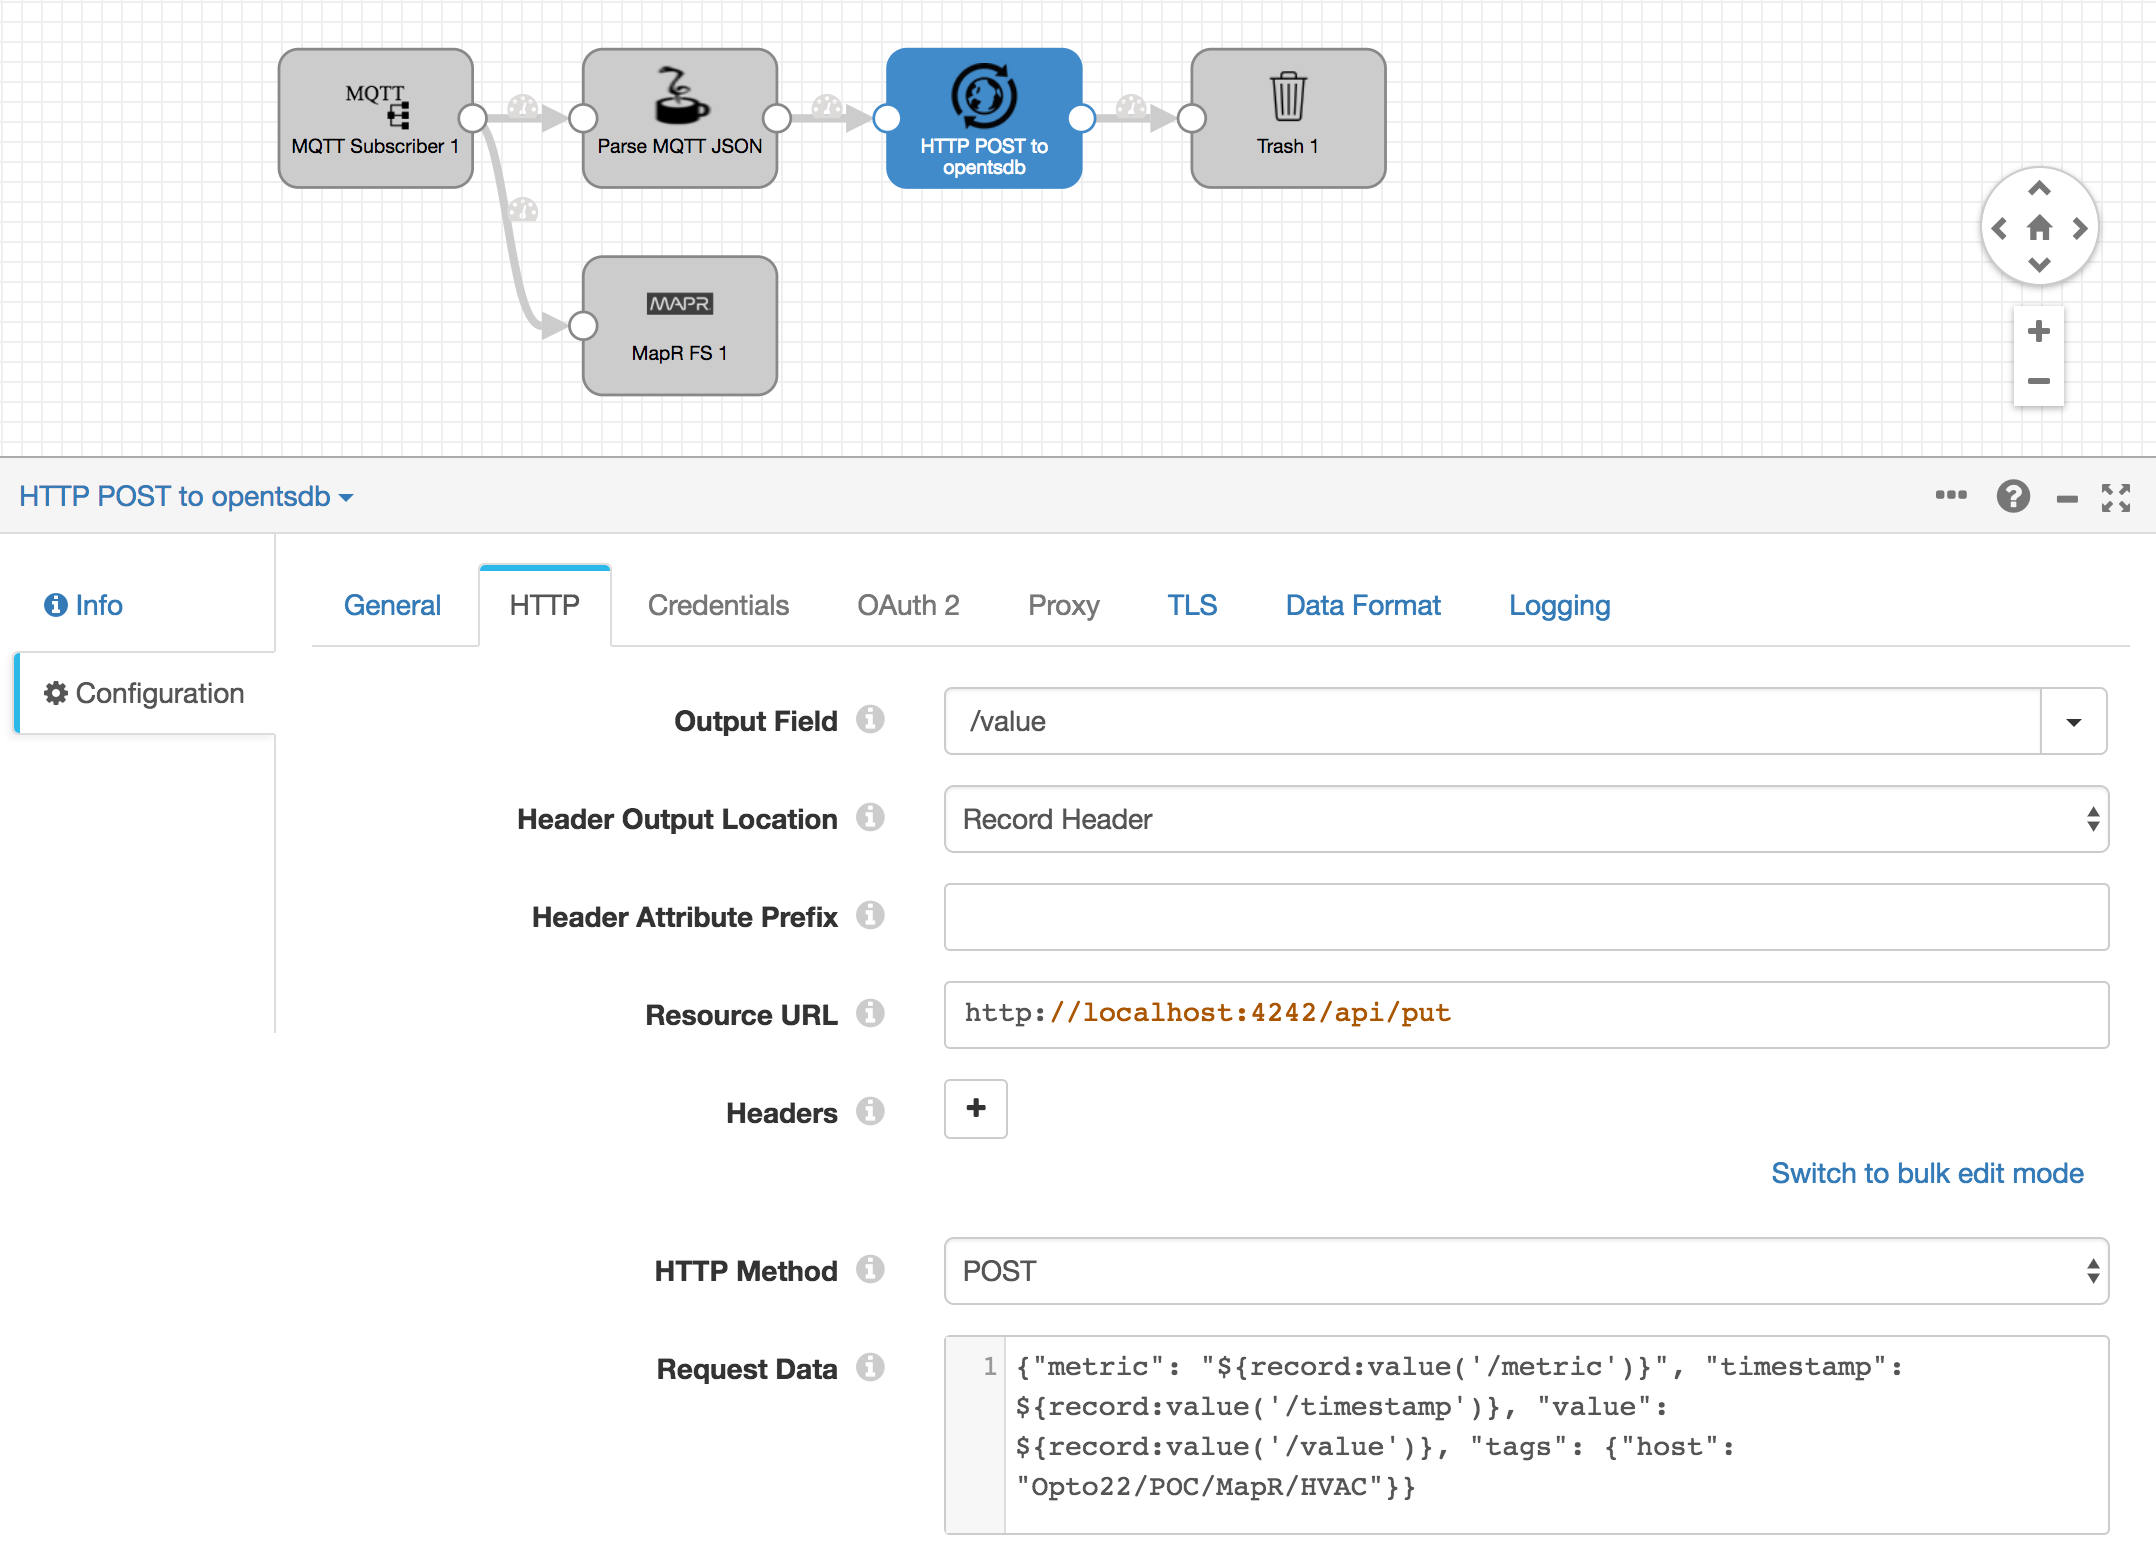
Now, I used the StreamSets HTTP Client stage to post each metric to my OpenTSDB instance running at http://localhost:4242/api/put:
{"metric": "${record:value('/metric')}", "timestamp": ${record:value('/timestamp')}, "value": ${record:value('/value')}, "tags": {"host": "Opto22/POC/MapR/HVAC"}}
The HTTP Client stage lets you get HTTP response codes, but I don’t care about those so I just connected this stage’s output to the Trash.
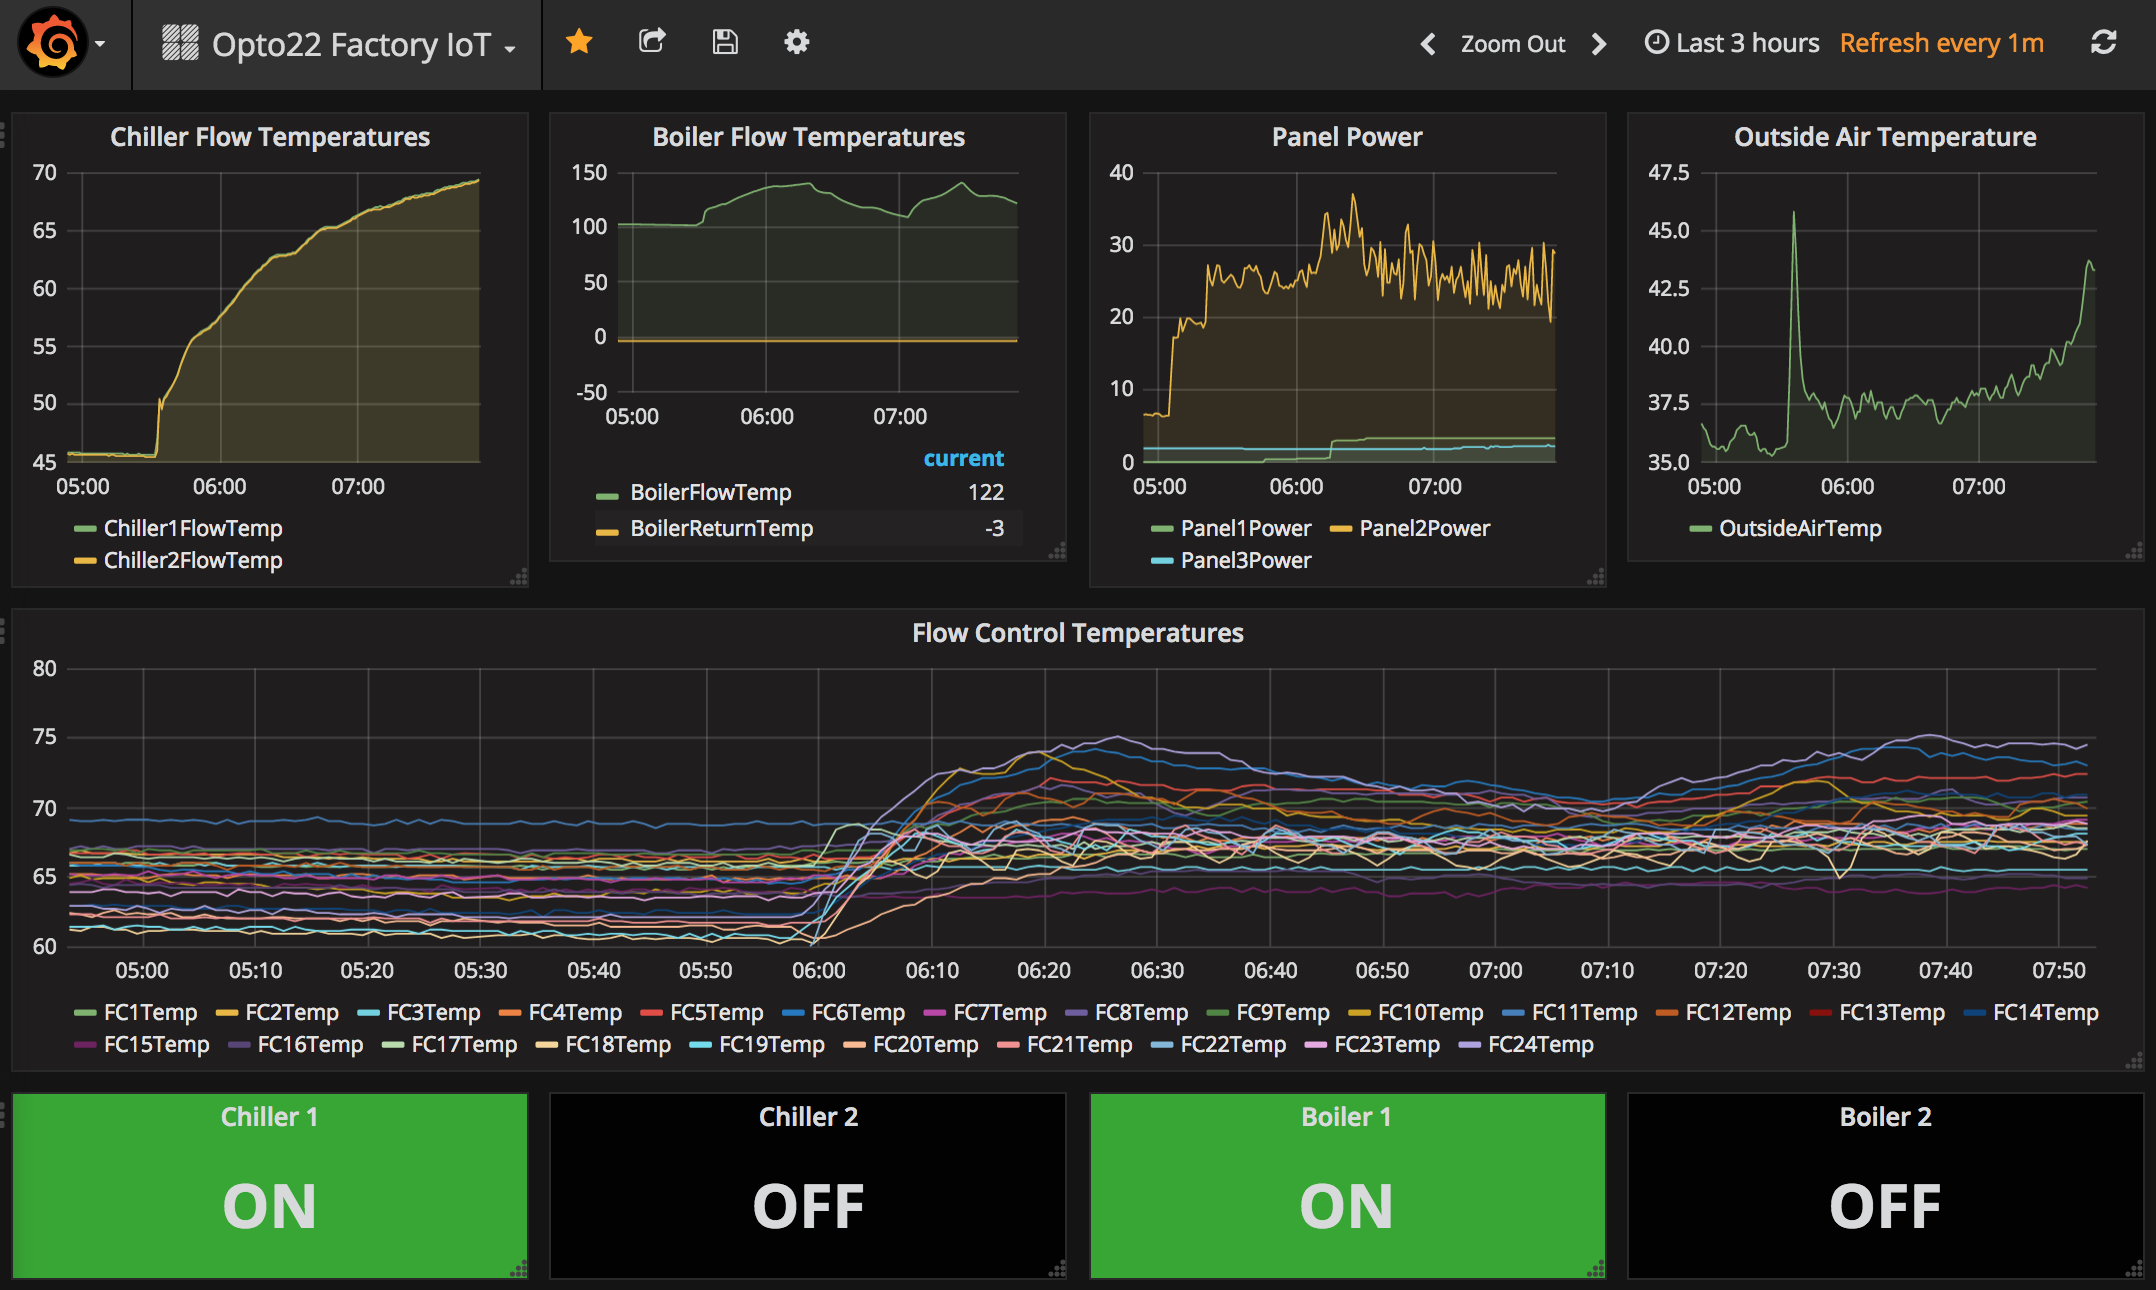
Visualization in Grafana
Grafana automatically picks up the metrics my StreamSets pipeline sends to OpenTSDB. Here’s what my Grafana dashboard looks like:
Troubleshooting tips for StreamSets
Here are some things I did to troubleshoot what I was building in StreamSets:
-
I used log.info() to debug my jython script.
-
I also discovered that I don’t need to worry about the u’’ unicode identifier in JSON fields. e.g. record.value[‘OutsideAirTemp’] is the same as record.value[u’OutsideAirTemp’]
-
It took me a while to figure out how to use the OpenTSDB REST API with the StreamSets HTTP client. One thing I had to figure out was that the StreamSets HTTP Client does not expect new lines in the JSON payload data. To troubleshoot that, I took the
curlcommand which I validated from bash:curl -X POST --data '{"metric": "sys.ian.test", "timestamp": '`date +%s`',"value": '$RANDOM',"tags": {"host": "web01","dc": "lga"}} http://localhost:4242/api/putand I ran that against a python web server shown here: https://gist.github.com/huyng/814831. I downloaded that
reflect.pyscript, ran it, then compared what that curl command looked like in the python web server with what the HTTP POST looked like coming from StreamSets.
Please provide your feedback to this article by adding a comment to https://github.com/iandow/iandow.github.io/issues/9.
