I’ve been spending a lot of time trying to maximize throughput for a Kafka data streaming pipeline. A large part of this effort has involved optimizations to data structures in my Java code. Generally speaking, anytime I use a data structure which is not a byte array, I sacrifice performance. But to precisely diagnose where and why my code is running inefficiently I use JProfiler. I like JProfiler because it integrates well with IntelliJ on my Mac and its user interface is nicely polished. You can learn more about JProfiler at http://www.ej-technologies.com/products/jprofiler/overview.html.
Here’s how I connect JProfiler on my laptop to monitor a Kafka consumer process running on my remote cluster:
First we need to install the JProfiler profiling agent on the cluster node where our application runs. Download the Jprofiler agent from https://www.ej-technologies.com/download/jprofiler/files. If you’re using Linux, installation is easy. I just untar’d it to my home directory.
Back on your laptop, open JProfiler. I’m currently using JProfiler version 9.2.
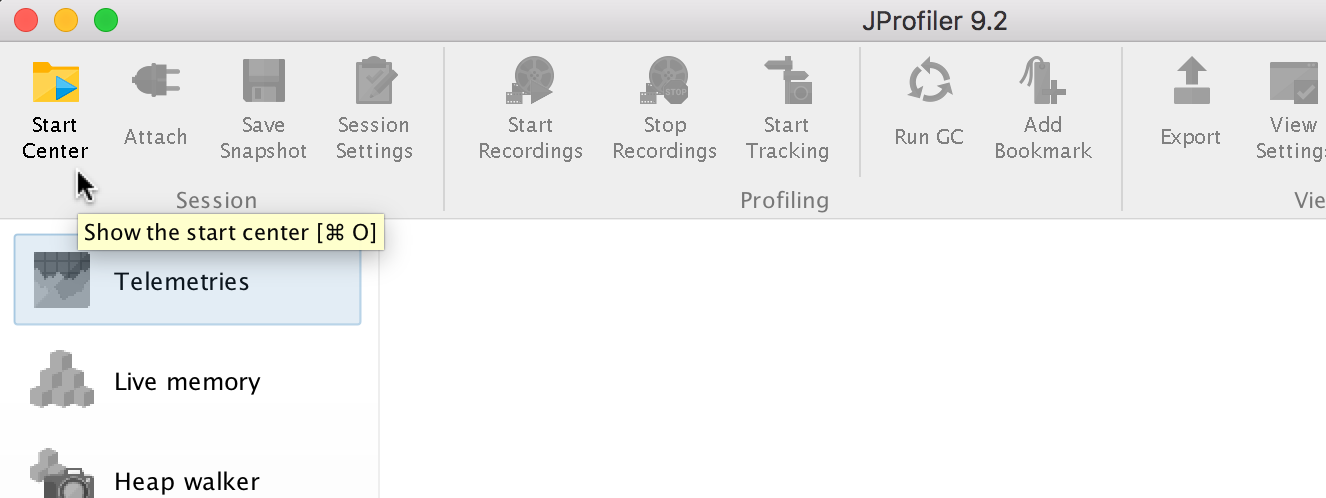
Next, open the Start Center.
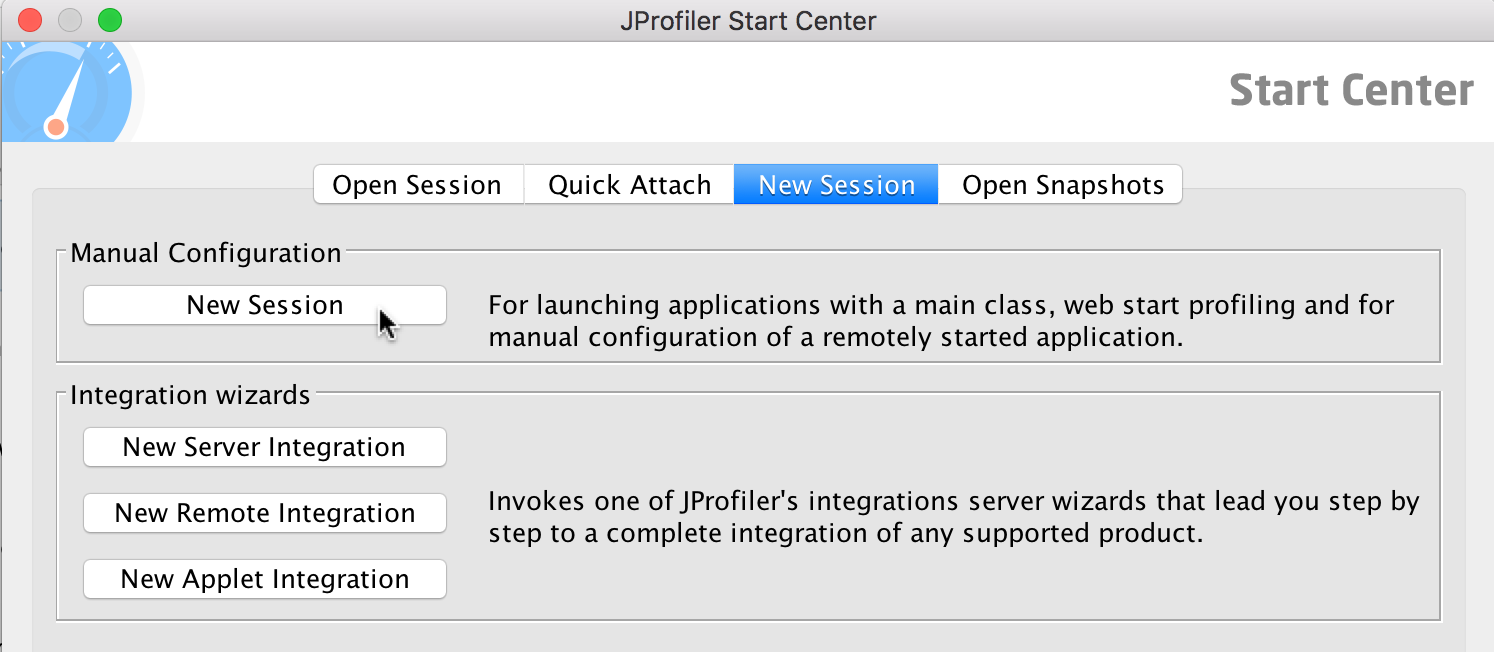
Then click New Session.
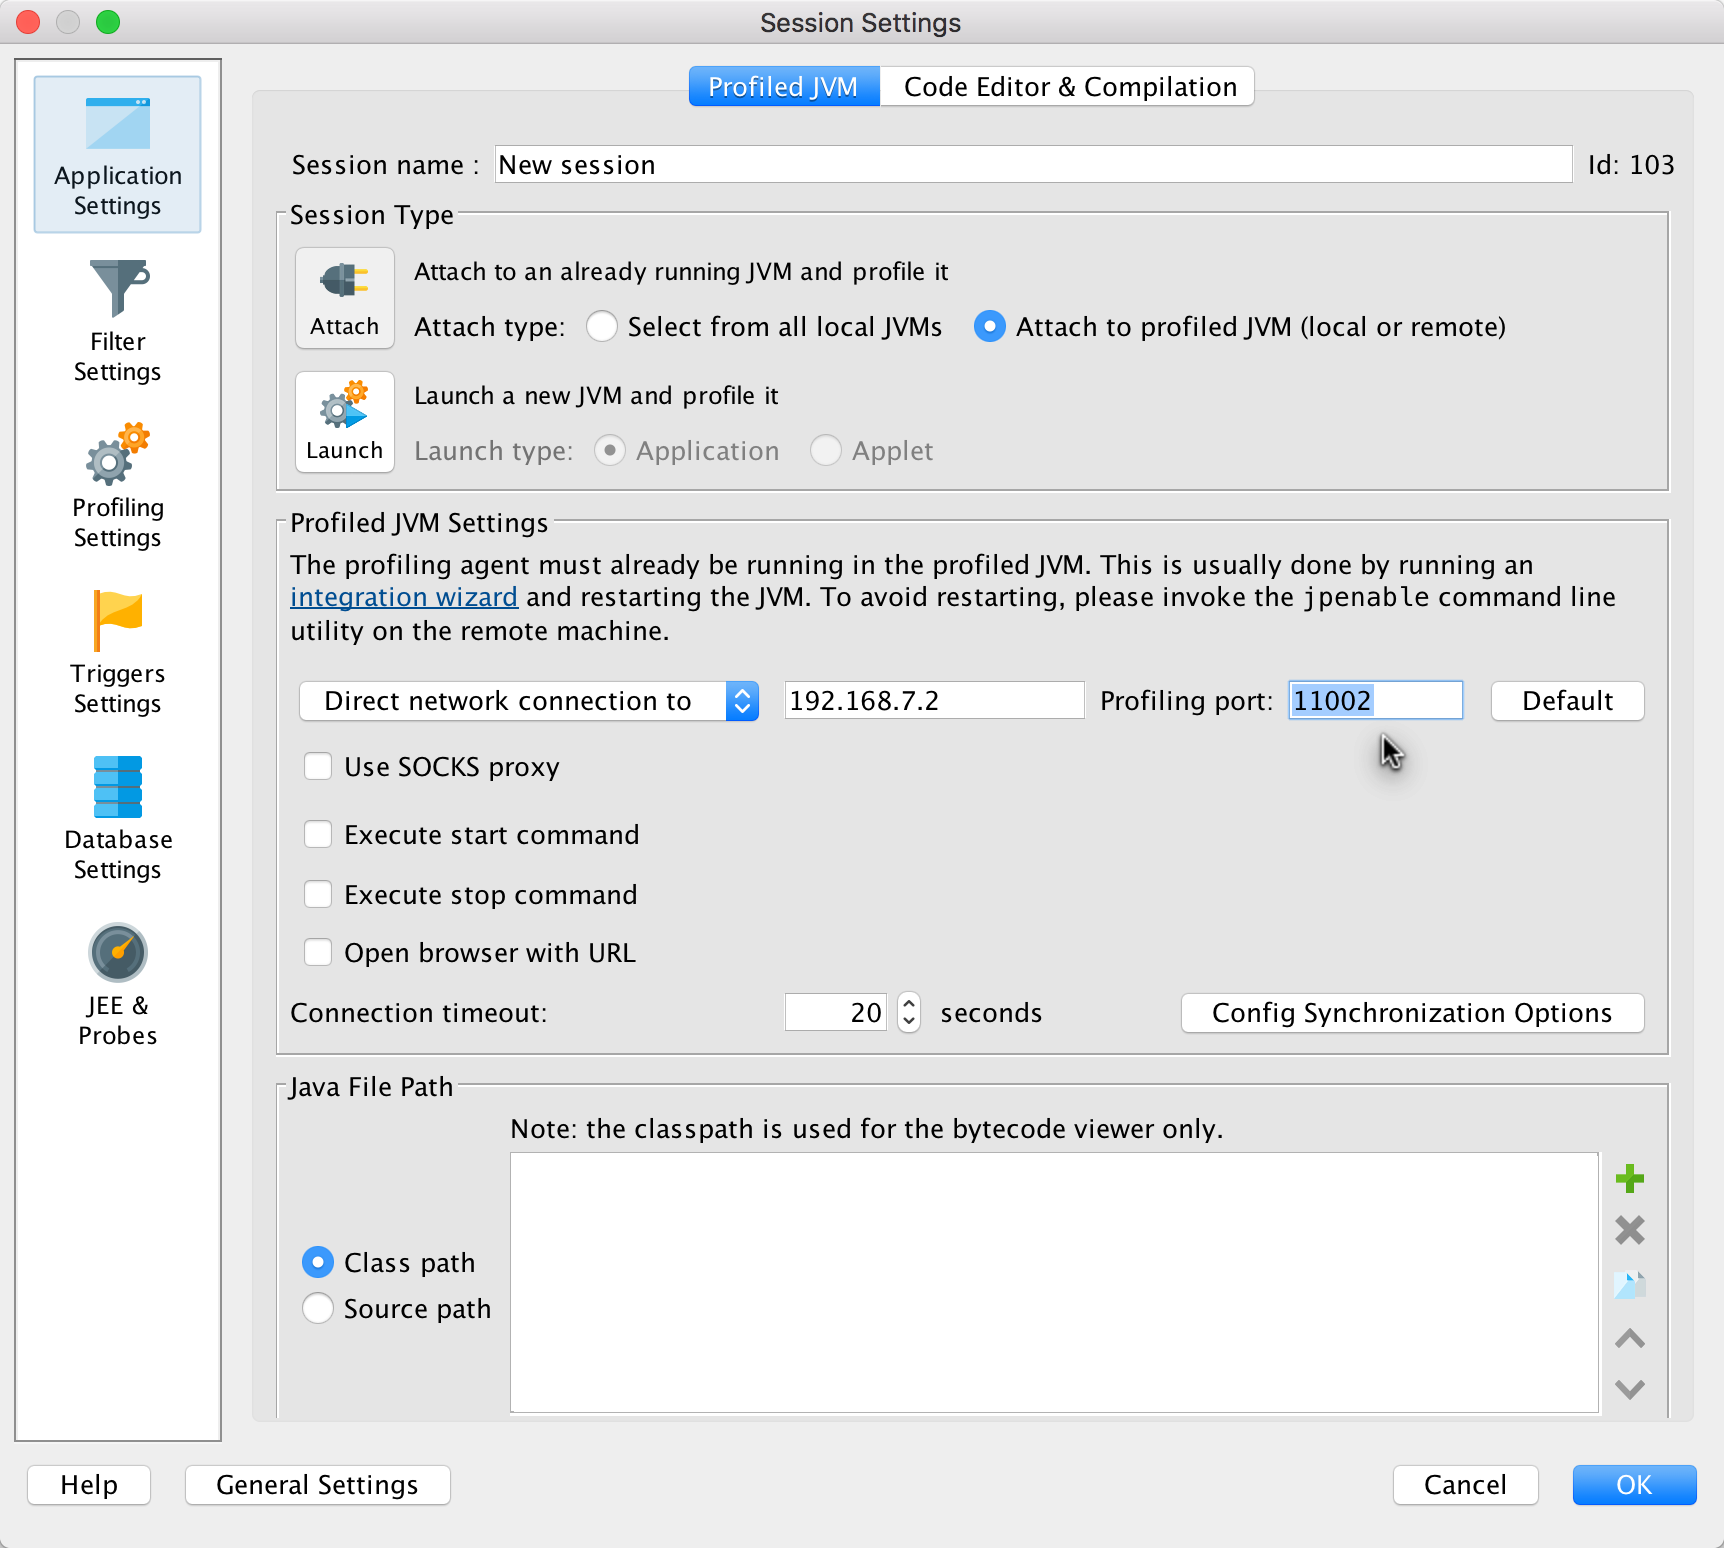
Under the JVM Settings, specify IP address and port to the profiling agent.
Once you click OK, it will wait on the following screen until you start your remote application.
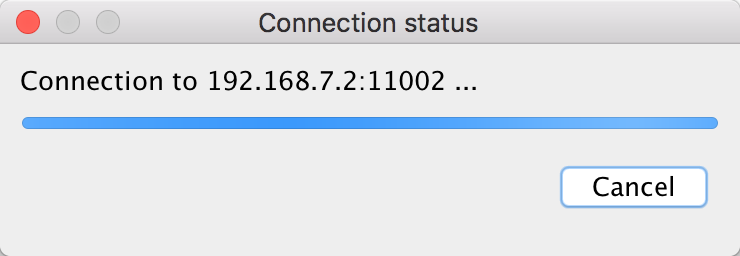
Finally, start your remote application with the profiling agent specified in the -agentpath command line argument, like this:
java -cp `mapr classpath`:nyse/nyse-taq-streaming-1.0-jar-with-dependencies.jar -agentpath:/home/mapr/jprofiler9/bin/linux-x64/libjprofilerti.so=port=11002 com.example.Run consumer /user/iandow/mystream:mytopicJProfiler should automatically connect, and you should be able to see really useful information about how your code is running, like this:
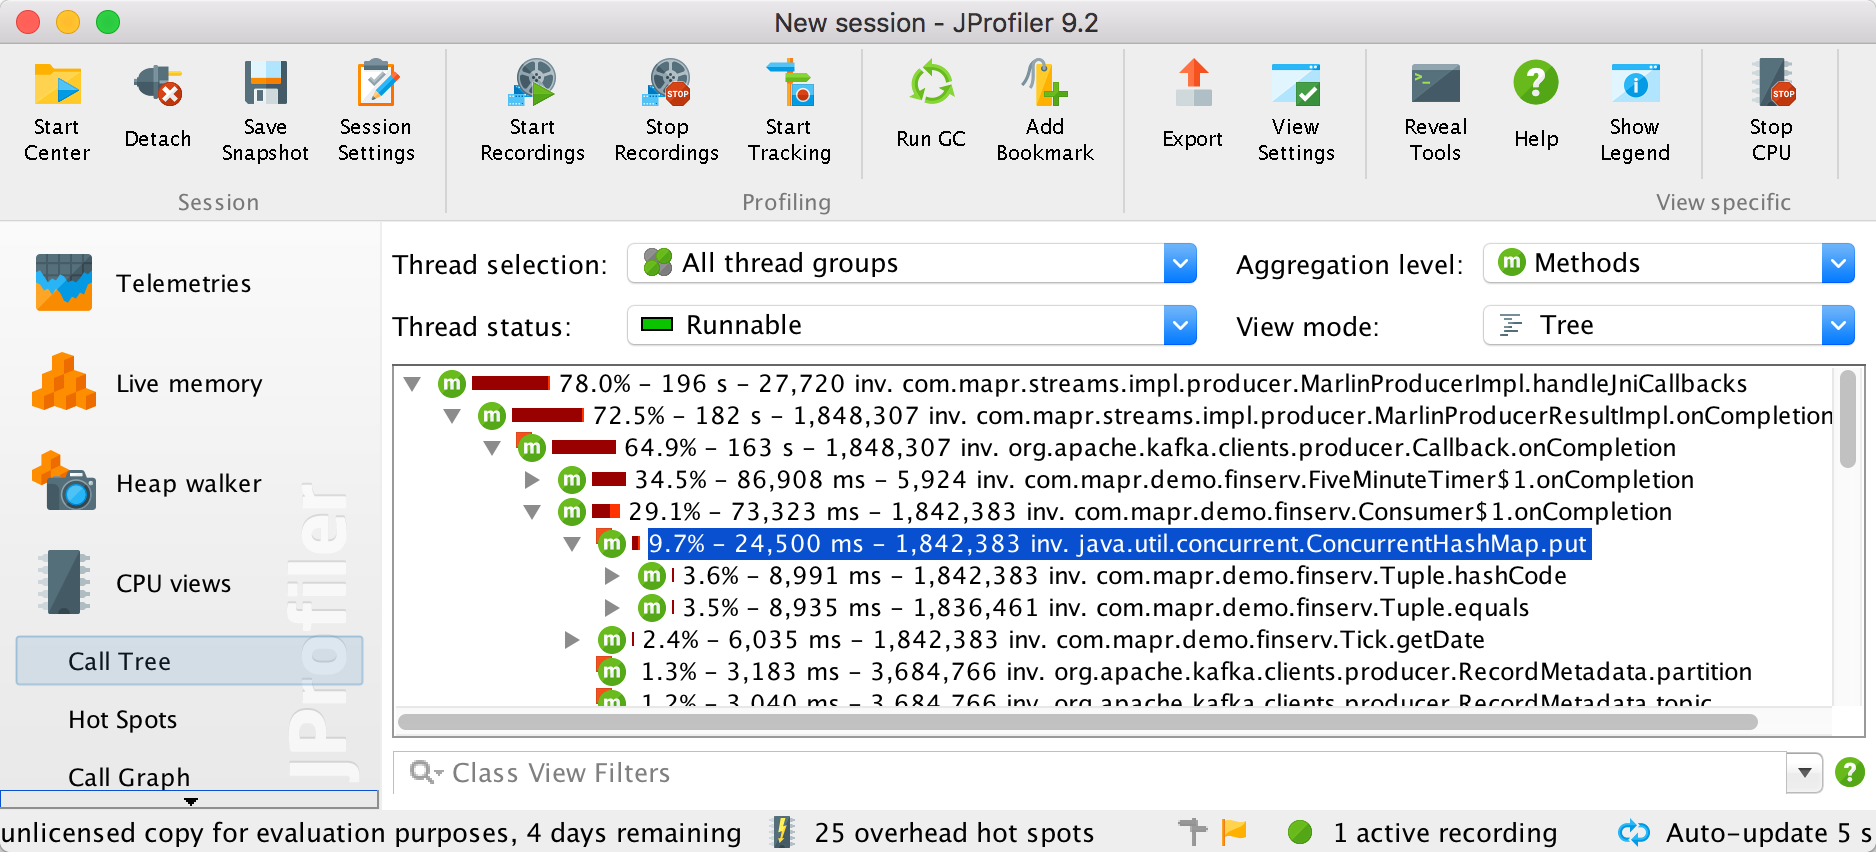
All done!
