Application developers often use debuggers to find and fix defects in their code. Attaching a debugger to a running application is straightforward when the runtime is local on a laptop but trickier when that code runs on a remote server. This is even more confusing for Big Data applications since they typically run in a distributed fashion across multiple remote cluster nodes. Fortunately, for Big Data applications implemented with the Apache Spark framework, it’s actually pretty easy to attach a debugger even as they run across a remote multi-node cluster.
My favorite IDE is IntelliJ. I use it to develop Spark applications that run on remote multi-node clusters. I configure maven to compile my application and all its dependencies into a single jar, then after I build my jar file I upload it to my remote cluster and run it like this:
$ /opt/mapr/spark/spark-1.6.1/bin/spark-submit --class com.mapr.test.BasicSparkStringConsumer /mapr/myclust1/user/iandow/my-streaming-app-1.0-jar-with-dependencies.jar /user/iandow/mystream:mytopicIn order to attach the IntelliJ debugger to my spark application I’ll define the SPARK_SUBMIT_OPTS environment variable and run it like this:
$ export SPARK_SUBMIT_OPTS=-agentlib:jdwp=transport=dt_socket,server=y,suspend=y,address=4000
$ /opt/mapr/spark/spark-1.6.1/bin/spark-submit --class com.mapr.test.BasicSparkStringConsumer /mapr/myclust1/user/iandow/my-streaming-app-1.0-jar-with-dependencies.jar /user/iandow/mystream:mytopic
After running that command, it will wait until you connect your debugger, as shown below:
$ /opt/mapr/spark/spark-2.0.1/bin/spark-submit --class com.mapr.demo.finserv.SparkStreamingToHive nyse-taq-streaming-1.0-jar-with-dependencies.jar /user/mapr/taq:sender_0310
Listening for transport dt_socket at address: 4000
Now you can configure the IntelliJ debugger like this, where 10.200.1.101 is the IP address of the remote machine where I’m running my Spark job:
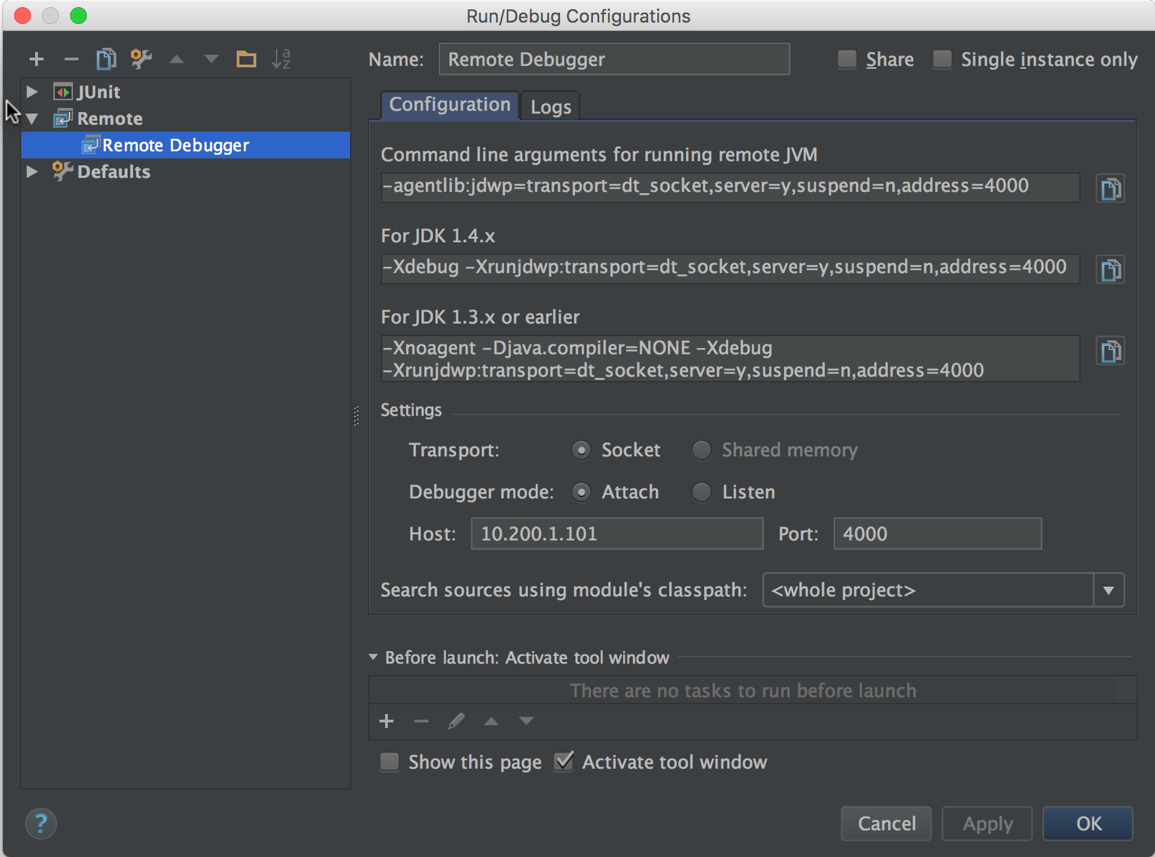
Start the debugger by clicking Debug under IntelliJ’s Run menu. Once it connects to your remote Spark process you’ll be off and running. Now you can set breakpoints, pause the Spark runtime, and do everything else you can normally do in a debugger. Here’s an example of what IntelliJ shows when pausing a Spark job with a breakpoint:
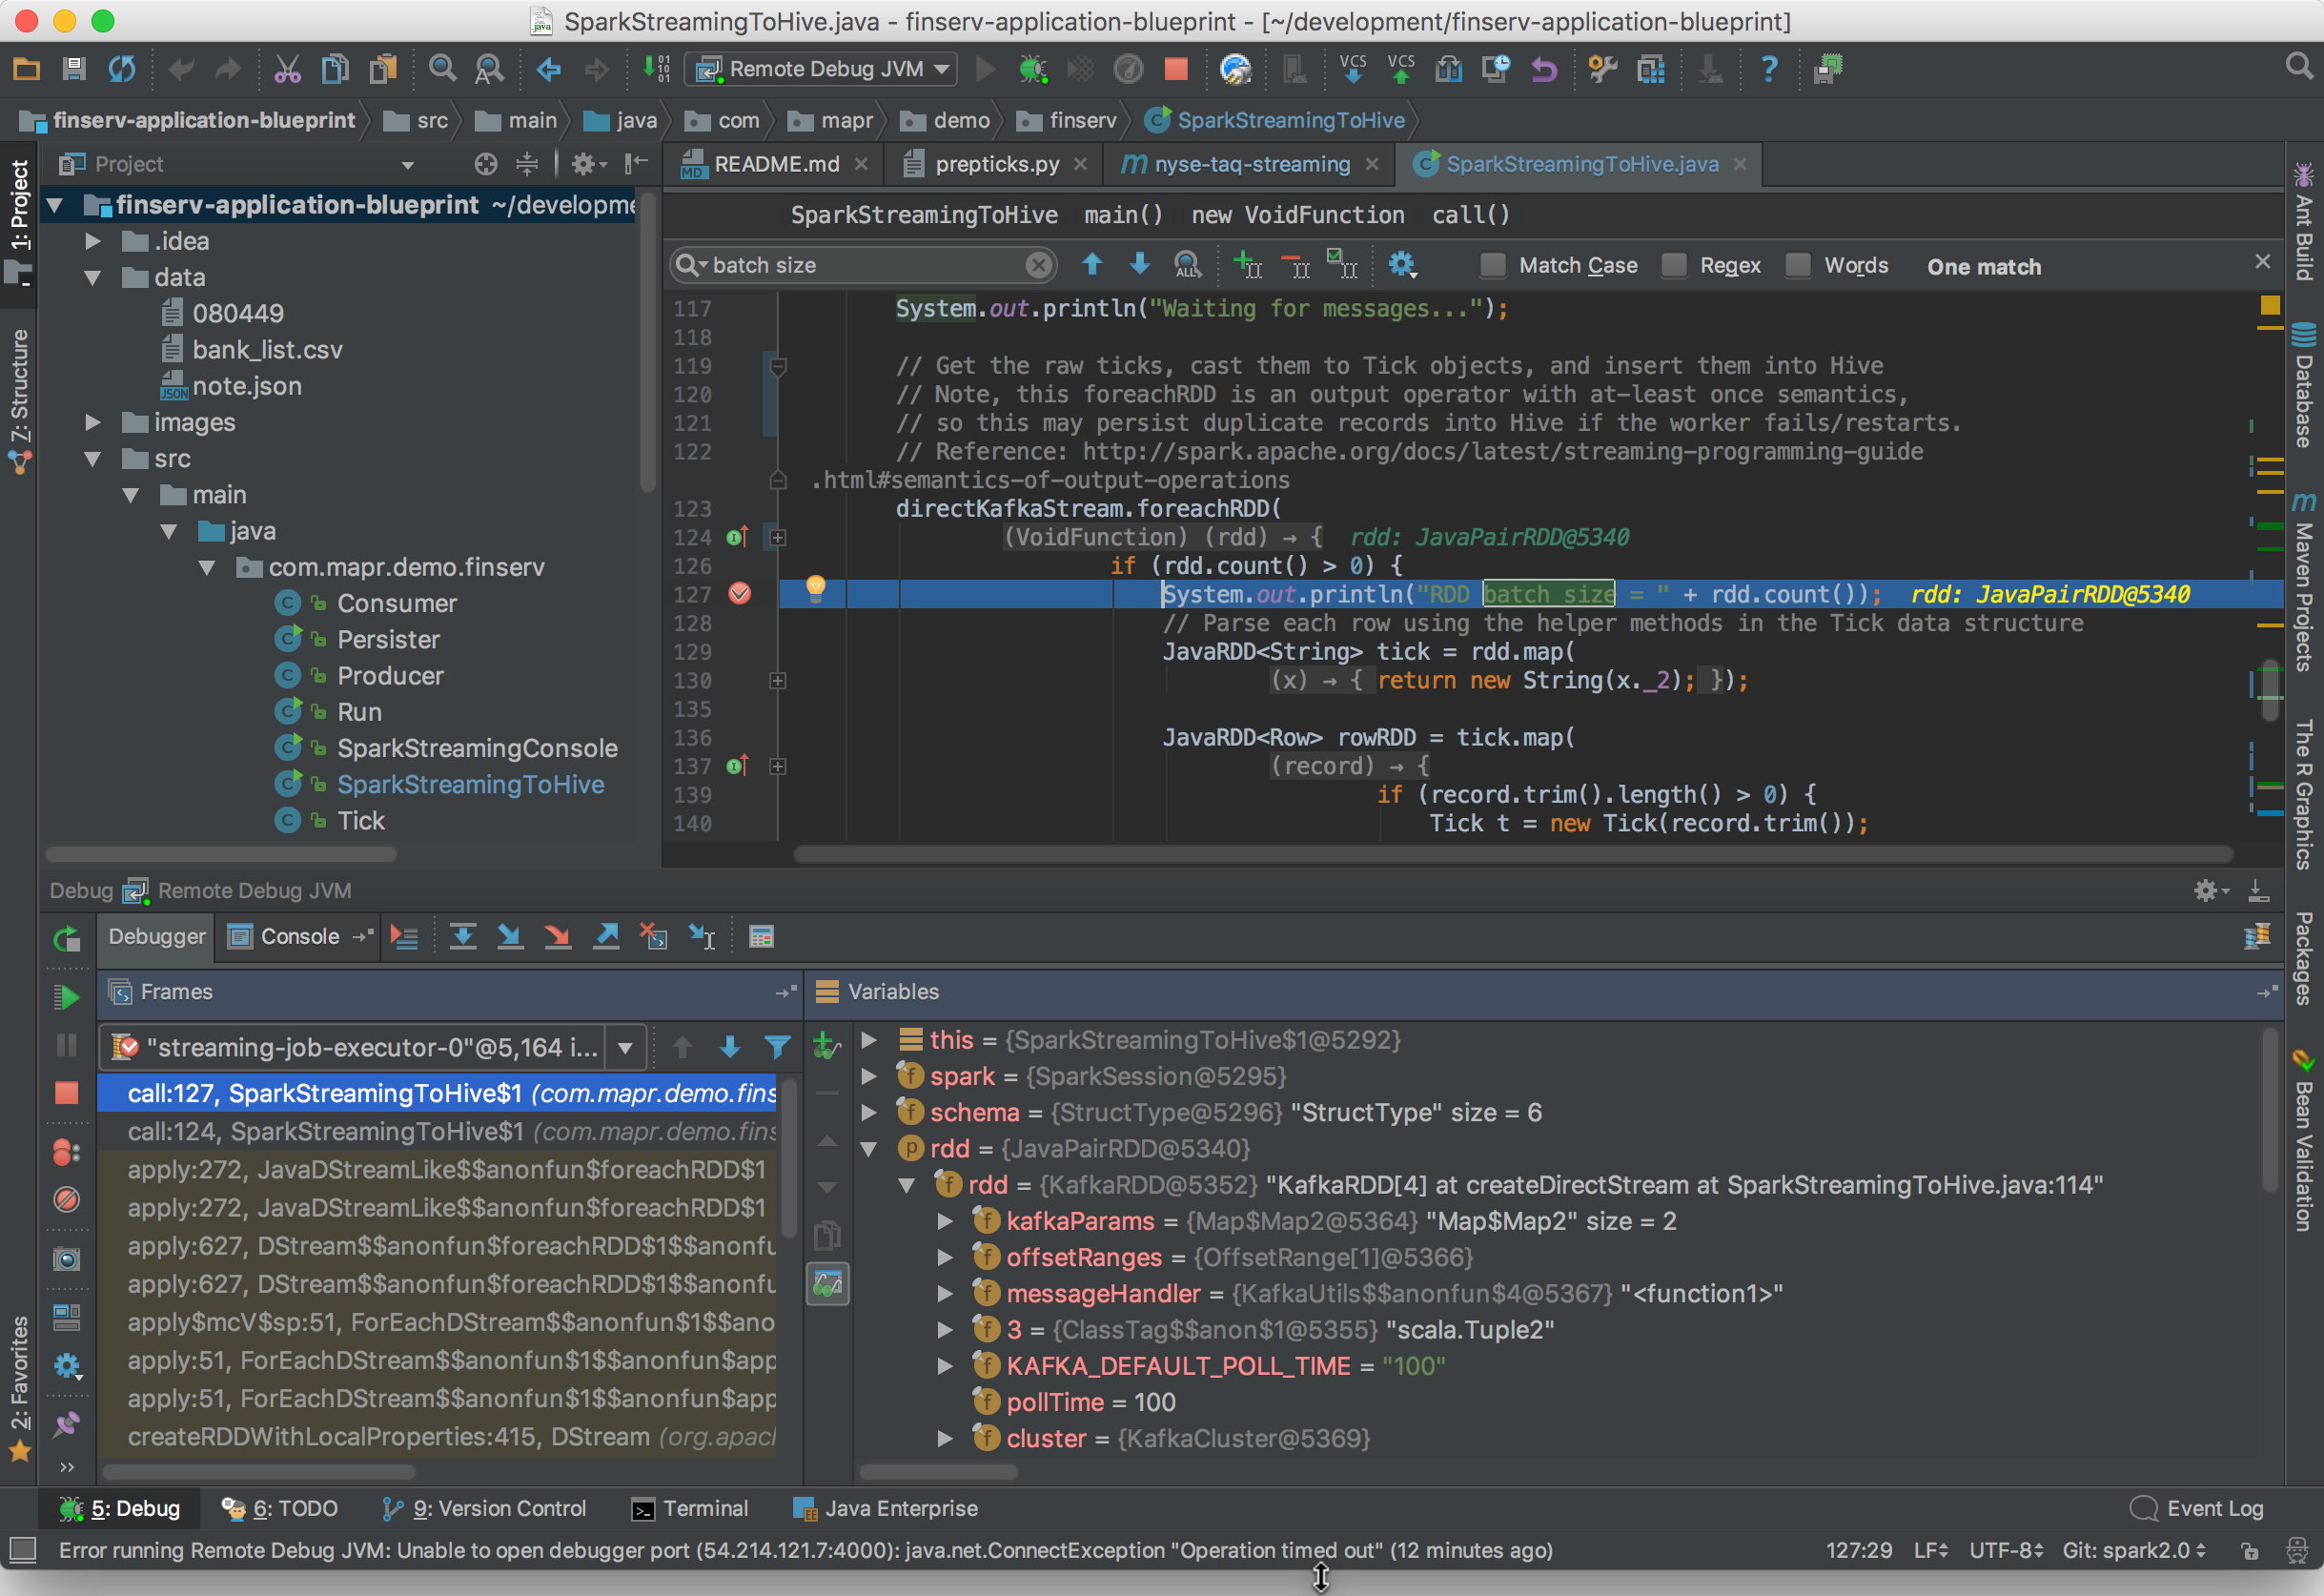
So, that’s how you attach IntelliJ’s debugger to a Spark application running on a remote cluster. Isn’t that nice!
